10 Key Metrics to Measure Customer Satisfaction and Improve Retention
ScaleLabs helps ops-heavy B2B teams ship client portals and workflow automation that reduce email chaos, speed up onboarding, and improve visibility across the business.
Every business talks about customer satisfaction; few actually measure it in a way that drives decisions. Satisfaction isn’t just a “feel-good” metric; it’s an early warning system. It shows whether customers are likely to stay, refer others, or quietly leave.
Yet, most teams rely on instinct or one-off surveys. The problem?
Gut feelings don’t show trends, and one survey score can’t explain why customers are happy today but frustrated next quarter.
That’s where customer satisfaction metrics come in.
These are measurable signals, from survey responses to behavioral data, that reveal how customers truly feel about your product, service, or experience.
Tracking the right metrics helps you:
- Spot satisfaction drops before churn happens.
- See which areas deliver the most value.
- Connect feedback to revenue, loyalty, and retention.
In short: Customer satisfaction metrics turn opinions into data, and data into action.
What Are Customer Satisfaction Metrics?
Customer satisfaction metrics are quantitative indicators that measure how happy customers are with your brand, products, or service. They’re built from feedback, interactions, and behavior, everything from survey scores to support ticket data.
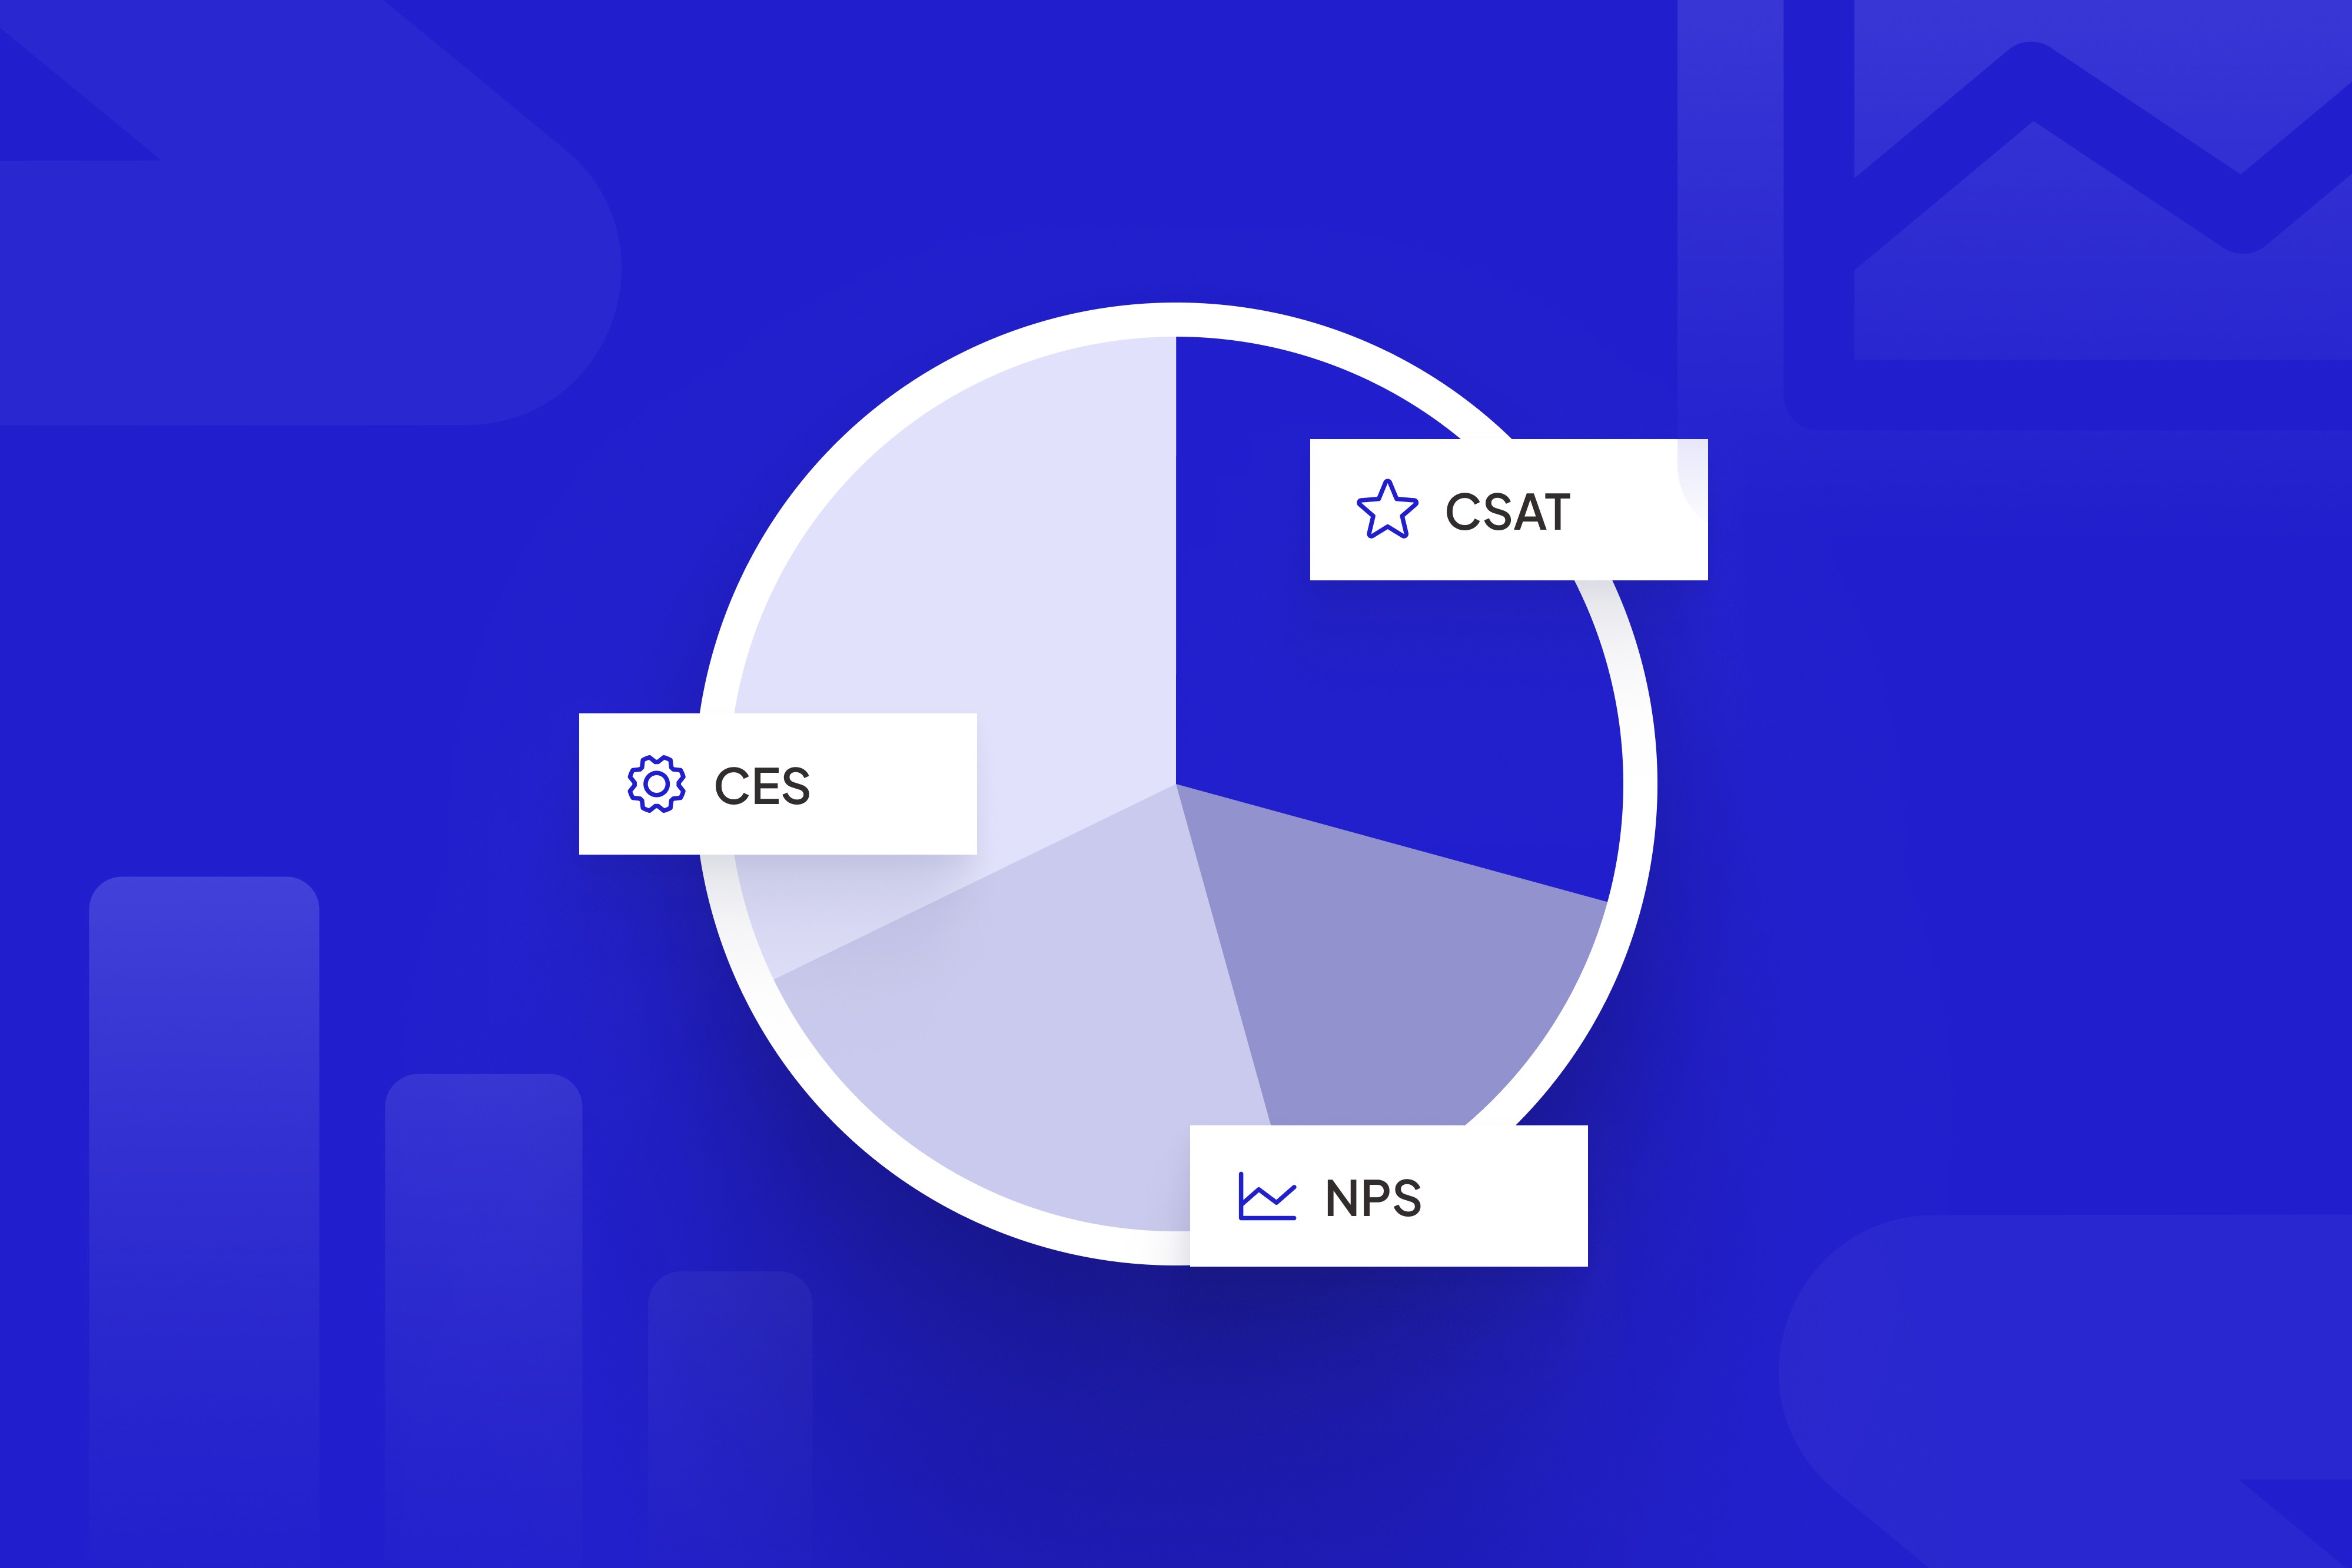
There are two main categories:
Type
Focus
Example Metrics
Perception-based
Measures how customers feel
CSAT, NPS, CES
Behavioral-based
Measures what customers do
Retention rate, Churn rate, CLV
Both are essential. Perception metrics capture sentiment in the moment, how easy it was to get help, how likely they are to recommend you, and how satisfied they feel.
Behavioral metrics show long-term loyalty, how often they return, how much they spend, or when they stop engaging. When combined, these metrics give a complete picture of customer satisfaction: emotion + action.
Example:
A SaaS company might have a strong NPS (loyal customers) but a high churn rate, suggesting customers like the product but find it too expensive or difficult to maintain. The metrics, together, tell the full story.
Think of these metrics as the voice of your customers, just translated into numbers.
Why Measuring Client and Customer Satisfaction Is Important
The link between satisfaction and business growth isn’t theoretical; it’s proven. According to Bain & Company, a 5% increase in customer retention can boost profits by up to 95%. That retention, in most cases, starts with satisfaction.
When companies measure satisfaction consistently, they:
- Reduce churn: unhappy customers are spotted early.
- Increase lifetime value: satisfied clients stay longer and spend more.
- Improve product decisions: real feedback guides what gets fixed or built next.
- Boost reputation: high satisfaction drives reviews, referrals, and advocacy.
For service businesses or B2B setups, the same applies under a different label: client satisfaction. In long-term relationships, satisfaction becomes the glue that holds partnerships together. A single missed response can erode trust; consistent care rebuilds it.
Satisfaction metrics don’t just track emotions; they measure momentum. They show whether your company is moving toward loyalty or losing it quietly.
10 Key Metrics to Measure Customer Satisfaction

- Customer Satisfaction Score (CSAT)
What it measures:
CSAT tells you how satisfied customers are after a specific interaction, like a purchase, support chat, or onboarding session. It’s one of the simplest and most widely used customer satisfaction metrics.
How it works:
Customers answer a quick question such as:
“How satisfied were you with your experience today?”
They choose a rating, usually from 1 (very dissatisfied) to 5 (very satisfied).
Formula: (Number of satisfied customers ÷ Total survey responses) × 100
Example: If 400 out of 500 respondents gave a 4 or 5, your CSAT score is 80%.
Why it matters:
CSAT gives an instant snapshot of satisfaction. It helps you detect small service issues before they become big retention problems.
- Net Promoter Score (NPS)
What it measures:
NPS measures how likely customers are to recommend your business — a strong indicator of loyalty. The survey question is simple:
“How likely are you to recommend us to a friend or colleague?”
Customers respond on a scale of 0 to 10.
Formula: Percentage of Promoters (scores 9–10) minus Percentage of Detractors (scores 0–6)
Example: If 70% of respondents are promoters and 10% are detractors, your NPS is 60.
Why it matters:
NPS highlights both enthusiasm and risk. Promoters often become advocates who refer new customers, while detractors point to areas that need attention fast.
- Customer Effort Score (CES)
What it measures:
CES focuses on how easy it is for customers to get what they want — whether that’s resolving a problem, completing a purchase, or accessing support.
How it works:
Customers rate how easy or difficult it was to achieve their goal, usually on a scale of 1 (very difficult) to 5 (very easy).
Formula: Total of all customer effort ratings ÷ Total number of respondents
Example: If 100 people respond with a combined rating total of 460, then CES = 460 ÷ 100 = 4.6.
Why it matters:
Ease is the biggest driver of loyalty. A smoother process equals higher satisfaction and lower churn.
- Customer Retention Rate (CRR)
What it measures:
CRR shows how many customers continue doing business with you over time. It’s one of the best metrics to measure client satisfaction, especially for service-based or subscription models.
Formula: (Customers at end of period – New customers acquired) ÷ Customers at start of period × 100
Example: If you start a quarter with 1,000 customers, gain 200 new ones, and end with 1,050,
then (1,050 – 200) ÷ 1,000 × 100 = 85% retention.
Why it matters:
The higher your retention rate, the more satisfied and loyal your customers are. A small increase in retention can significantly boost long-term profitability.
- Churn Rate
What it measures:
Churn rate shows the percentage of customers who stop using your product or service within a certain period. It’s essentially the reverse of retention, a critical indicator of declining satisfaction.
Formula: (Customers lost during a period ÷ Total customers at the start) × 100
Example: If you start with 1,000 customers and lose 80 by month-end, your churn rate is 8%.
Why it matters:
Churn helps identify when and why customers leave. A sudden rise in churn usually means something has gone wrong with pricing, support, or product experience. Tracking it alongside retention helps you see both loyalty and risk clearly.
- Customer Lifetime Value (CLV)
What it measures:
CLV shows how much revenue you can expect from a single customer over the entire duration of their relationship with your business. It connects satisfaction to long-term profitability; happy customers stay longer and spend more.
Formula: Average purchase value × Average number of purchases per year × Average customer lifespan (in years)
Example: If a customer spends $200 per purchase, buys four times a year, and stays with your brand for three years, CLV = 200 × 4 × 3 = $2,400.
Why it matters:
A rising CLV usually means higher satisfaction and loyalty. Tracking this over time helps you understand whether your retention strategies are truly working.
- First Response Time (FRT)
What it measures:
FRT calculates how long it takes your team to reply to a customer’s inquiry or support ticket. It’s a simple but powerful reflection of your responsiveness.
Formula: Total time taken to respond to all customer inquiries ÷ Total number of inquiries
Example: If 50 tickets took a combined 500 minutes to get a first reply, FRT = 500 ÷ 50 = 10 minutes.
Why it matters:
Fast responses create trust. When customers feel heard quickly, their satisfaction scores (especially CSAT and NPS) improve dramatically.
Tip: Benchmark your FRT against industry standards. For SaaS, under 1 hour is excellent; for e-commerce, under 15 minutes for chat is ideal.
- Customer Reviews and Rating Trends
What it measures:
Online reviews are public proof of customer satisfaction. Tracking the average rating and sentiment over time reveals whether perception is improving or slipping.
How to measure:
Collect ratings from major platforms (Google, G2, Trustpilot, Yelp, or your own feedback forms). Calculate the average rating and track changes monthly or quarterly.
Example: If your product rating improves from 4.2 to 4.5 over six months, it signals stronger customer satisfaction and better reputation management.
Why it matters:
Ratings influence new buyers and reflect how your customers truly feel — even more than surveys. Consistent improvement here means your satisfaction strategies are working publicly, not just internally.
- Customer Health Score
What it measures:
A composite score that combines multiple data points, product usage, engagement, support tickets, and payment activity, to show overall client satisfaction and account stability.
How to measure: Assign weighted values to key behaviors, such as:
- Product usage (40%)
- Support interaction quality (30%)
- Renewal likelihood (30%)
Combine them into a 0–100 score, where higher means healthier.
Example: A B2B client with a health score above 85 is considered stable and satisfied, while one below 60 may be at churn risk.
Why it matters:
For SaaS and service companies, this is the most proactive client satisfaction metric, it predicts risk before customers even complain.
- . Referral and Advocacy Rate
What it measures:
This metric shows how many satisfied customers actively refer others, a true sign of loyalty.
How to measure: (Number of customers who referred others ÷ Total customers) × 100
Example: If 120 out of 1,000 customers have referred at least one person, your referral rate is 12%.
Why it matters: Referrals are the ultimate satisfaction proof; people only recommend what they genuinely trust. A growing referral rate means your customers are doing your marketing for you.
Quick Summary:
Metric
Purpose
How to Measure
CSAT
Direct satisfaction
Post-interaction survey
NPS
Loyalty & advocacy
Recommend question (0–10)
CES
Ease of interaction
Effort rating (1–5)
CRR
Retention
End–start ÷ start × 100
Churn
Loss rate
Lost ÷ start × 100
CLV
Profitability per customer
Value × frequency × lifespan
FRT
Response speed
Total time ÷ inquiries
Reviews
Sentiment trend
Avg rating over time
Health Score
Overall account wellness
Weighted activity score
Referral Rate
Advocacy strength
Referrers ÷ total × 100
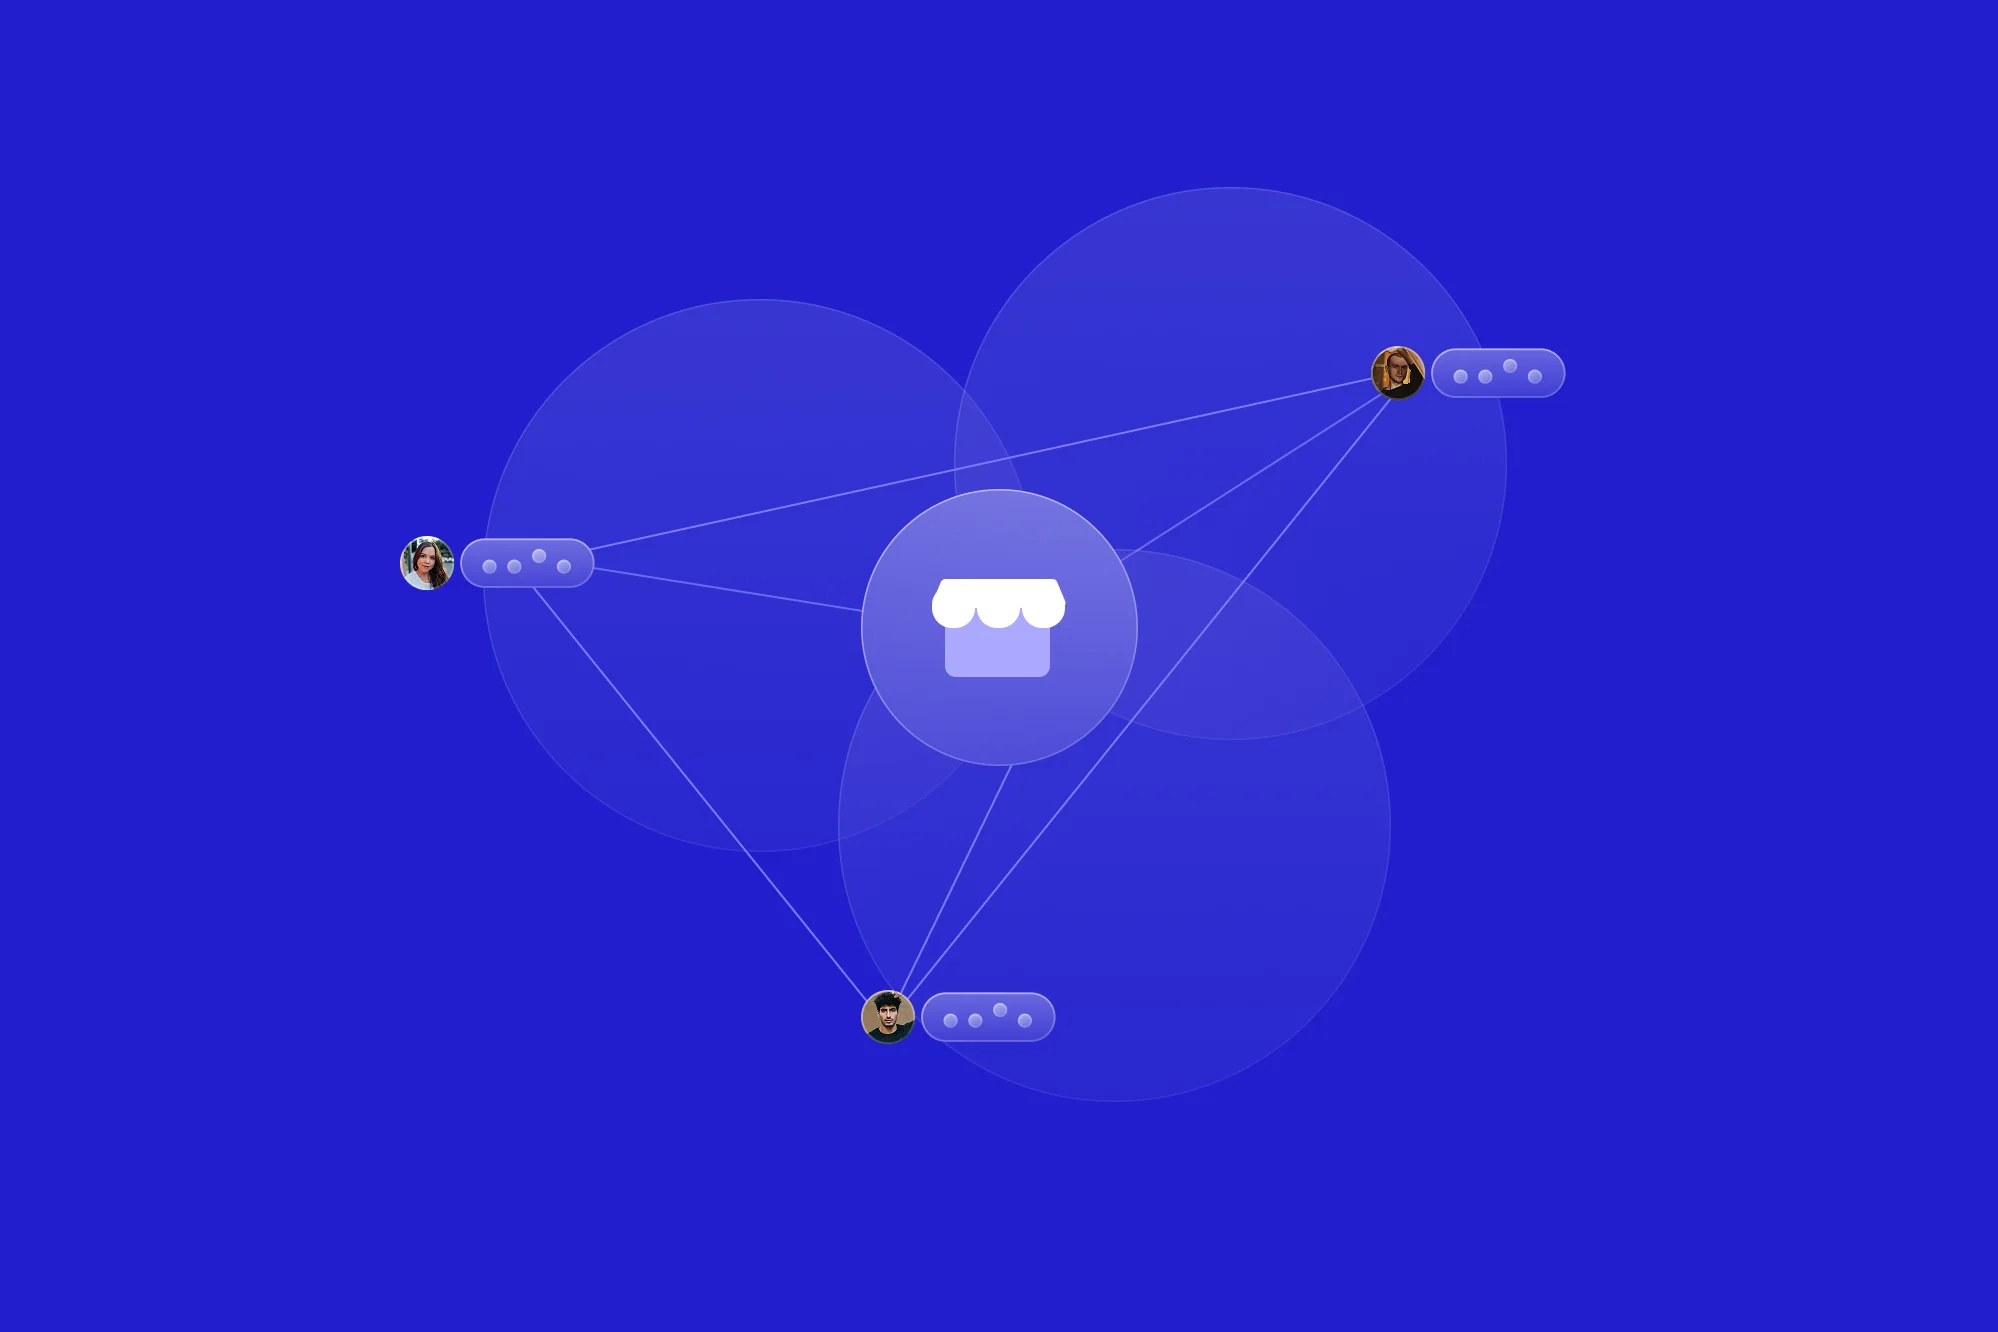
How ScaleLabs Helps You Measure and Improve Customer Satisfaction
Measuring satisfaction is only half the job; turning those insights into action is where growth happens.
That’s what ScaleLabs is built for.
Our platform centralizes all your customer and client satisfaction metrics, from surveys and reviews to retention trends, in one dashboard. You can track CSAT, NPS, CES, churn, and CLV in real time while automating the feedback loops that improve them.
Here’s how ScaleLabs helps:
- Unified tracking: Connect feedback forms, CRM data, and support metrics into one clean dashboard.
- Automated analysis: Identify patterns behind rising or falling satisfaction scores without manual number-crunching.
- Client visibility: Let account managers see satisfaction trends by region, team, or customer segment.
- Alerts and actions: Get notified when scores dip, so your team can act before issues become churn.
Whether you’re managing clients, vendors, or customers, ScaleLabs helps you see the full story behind your satisfaction metrics and gives you the tools to improve them.
Turn Your Satisfaction Data Into Strategy
Customer feedback shouldn’t sit in spreadsheets; it should guide every decision. With ScaleLabs, you can track the right metrics, visualize them clearly, and respond faster.
See how satisfaction becomes measurable growth.
Talk to our team →
FAQs About Customer Satisfaction Metrics
What are the most common metrics used to measure customer satisfaction?
The most popular satisfaction metrics are CSAT (Customer Satisfaction Score), NPS (Net Promoter Score), and CES (Customer Effort Score). Together, they measure how happy customers are, how loyal they feel, and how easy it is to interact with your business.
How often should you measure customer satisfaction?
Most businesses measure satisfaction at key touchpoints, after purchase, after support interactions, and quarterly or biannually for long-term clients. The key is consistency, not frequency: track regularly enough to see patterns, not survey fatigue.
What’s the difference between customer satisfaction and customer loyalty?
Satisfaction measures how happy customers are right now. Loyalty measures how long they stay and how often they return. You can be satisfied once and never come back; loyalty shows deeper trust and retention.
What is a good CSAT or NPS score?
- A CSAT score above 80% is generally considered excellent.
- A Net Promoter Score (NPS) above 50 indicates strong loyalty and advocacy.
Scores vary by industry, but improvement over time matters more than hitting benchmarks.
How can a client or vendor portal improve satisfaction tracking?
Portals simplify data collection. Instead of sending multiple surveys or emails, clients and vendors can log in, update documents, and provide feedback in one place. Platforms like ScaleLabs integrate this feedback with real-time analytics, making satisfaction measurable and actionable.